|


October 2000
New Millennium,
| |||||||||||||
| Swap File Monitor -- It displays the size of the swap file in text and shows the size graphically as a percentage of available swap file space. |
| Memory Usage Monitor (RAM Meter)-- It displays the amount of memory available. |
 TCP/IP Throughput Monitor (Object Netscan) -- Object Netscan provides a graphical display of both TCP/IP input and output activity. The "zero point" of the graph is in the center; input is displayed above the zero line and output is displayed below. Depending on configuration, it can provide textual data on current input and output, peak input and output, average input and output, and total data received and sent. All text values are shown in characters per second.
| CPU Activity Monitor -- It provides a running indication of current processor activity as a graphical display, a text value, or both. |  |
Ways and Means...
Despite the context of the Control Center, the Object Desktop system monitoring enhancements run as individual processes. Replacements might operate in either of two ways:
- Discrete Applications: Over the years, a number of applications have been written that address one (or, sometimes, a few) of my monitoring requirements. These could be used as piecemeal replacements. The advantage of such an approach would be to find and use "best of breed" monitoring applications -- maybe. The disadvantage would likely be a clutter of mismatched windows that would almost certainly defy any rational attempt at arrangement thereby reducing the usefulness of the selected applications, in aggregate.
- An Integrated Monitoring Application: Authors have been much less prolific in this arena. The expected advantage of an integrated application is a "seamless" appearance which should be easy to place and arrange on the screen. A possible disadvantage might be the need to accept one or more less-than-optimum monitoring processes -- maybe.
Seeking Discrete Alternatives
While a collection of discrete monitor applications has significant drawbacks, I would be remiss not to review what is available.
The easiest way to begin a search is at home. I have been collecting OS/2 "utilities" since what seems like '01 but is really only since the late 1980s. Despite a couple of hard drive failures and the transfer of files through three generations of systems, I still have most of my collection. This is either rare foresight -- which is doubtful -- or an indication of my inability to perform any meaningful housekeeping.
Whatever the reason, this collection was a good starting point in the search for discrete monitoring applications. To supplement, I also reviewed Hobbes and the BMT Micro catalog. These are what I found:
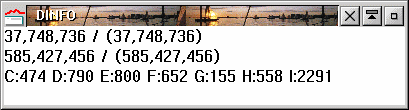
- DInfo -- This IBM EWS program (circa 1992) is in my utility collection. Depending on configuration, it shows current and maximum swapper size; current and minimum swapper free space; and space available on each local partition. Data is reported as text in a PM window. Note: DInfo mis-reports available space on very large partitions.
 Freemem -- This little orphan program is also in my utility collection. I have no information on its origins, and it lacks configuration features and help facilities. It reports available free memory as text in a PM window. Analysis suggests that Freemem reports the amount of free memory above the last committed memory address, which is misleading.
 Memsize -- Yet another program in my utility collection, Memsize was written by Richard Papo and is copyright 1992. It monitors available memory (and mis-reports the amount available, just as does Freemem); swap file size; available swap file space; and, if configured to do so, the available space on each local partition (it also mis-reports available space on very large partitions). It can be configured to report current CPU activity, but with a significant performance hit (the WarpCenter System Activity monitor reports 100% utilization).
- WarpCenter -- One would be remiss to ignore the system monitoring facilities of the WarpCenter. An integral part of Warp 4, WarpCenter can be configured to include a system activity graph and bars showing allocated and free space for all (or selected) disk partitions.
-
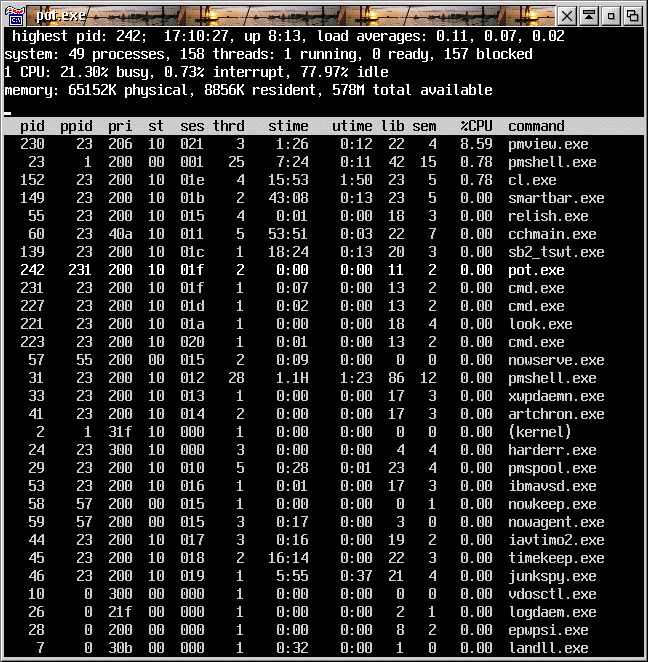
CPULoad -- This is a fairly neat freeware client-server utility from Hobbes. It was written and released in April 1999 by Spyros Melissovas and Vagelis Savvas. The server provides low-impact load statistic collection, including CPU averages at 1-, 5-, and 15-minute intervals. Named pipes are used to communicate collected data to any of four clients (two PM window clients, an UPTIME utility, and a utility called POT that is said to be a clone of the *nix TOP utility). 
POT Utility
Here's a PM Client Display
Seeking Integrated Alternatives
Integrated system monitor utilities are a more ambitious undertaking than discrete utilities. They are a fairly recent development in OS/2 utilities, and my search has only revealed two contenders:

WarpBar -- This is a freeware utility available on Hobbes. It was written by Alex Spanidis and was released in early 1998. It provides a comprehensive set of monitors (as you can see by clicking on the reduced image here), including: date, time, system up time, virtual memory available, physical memory available, total memory available, swap file size, "up time," monitors for available disk space for as many local partitions as there is space to track, graphical and text processor activity monitors, TCP/IP inbound and outbound statistics, and a pop-up command line for launching programs. It can be configured to check mail at specified intervals, but this is probably only useful if one is directly connected to the Internet. WarpBar makes little use of graphics (only the processor monitor is graphic). This gives it a very low overhead, but makes it crowded and hard to read.SmartBar -- This "cardware" utility (you are asked to send an e-mail message to the author letting him know you are using the program) is available from Hobbes. The primary author is Alessandro Rossi, with language assistance by Massimo Frigento, Robert Henschel, and Guillaume Gay. SmartBar is currently at release 3.0 (May 2000) and is under active development. The monitoring facilities are comprehensive and it looks good! 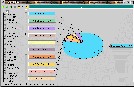
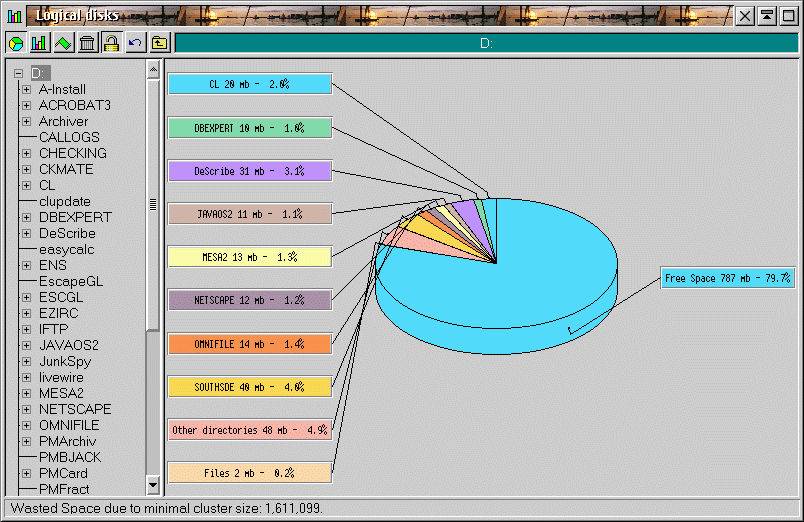
Display Showing
Logical Disk Details
SmartBar -- Good Features, Easy to Use
If the description of SmartBar sounds like the integrated monitoring utility of my dreams -- it is. It has a wealth of monitoring features, all of which work well, provide valuable information, and don't impose an undue load on system resources.
SmartBar Features: If you think you might want to monitor some aspect of your system, chances are, SmartBar can do that:
- System Information Monitors: My primary focus is on the monitoring of system resources. SmartBar is comprehensive in this regard:
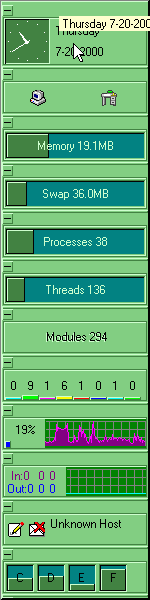
- Memory -- Committed memory is shown in both graphic and text form
- Swap File -- Size is shown in both graphic and text form; the graphic depicts swap file size relative to available swap file space
- Processes -- The number of running processes is shown in both graphic and text form
- Threads -- The number of threads currently launched and operational is shown in both graphic and text form
- Modules/Files -- The number of modules (DLLs) loaded is shown in text format; file count is currently disabled
- Monitor Processes -- Each process is shown as an element in a bar graph; the rough percentage of processor activity used by a process is shown in text above the bar; a configuration option allows idle processes to be eliminated from the display
- Processor Monitor -- A graphic displays processor activity, similar to the system activity monitor in the WarpCenter. The monitor can be configured to also display the current percentage of processor activity (either as a true percentage or in terms of megahertz -- the worth of which escapes me).
- TCP/IP Monitor: SmartBar's TCP/IP monitoring facilities include an activity graphic showing input activity in one color and output activity in another. It can also be configured to display maximum, average and current input and output text data.
- Mail Monitor: If you are connected to the Internet through something more than a dial-up connection, SmartBar can be configured to periodically check up to three different e-mail accounts. If mail is waiting, the configuration can include a start command to launch your e-mail program and retrieve the waiting mail.
- Hardware Sensor Monitor: If your hardware supports monitoring, SmartBar knows it and allows you to monitor up to two different temperatures, fan operation, and power supply voltages.
- Storage Monitors: SmartBar provides facilities to monitor:
- Physical Disks -- Reports the number of reads and writes (and the accumulated errors for each operation) for each physical hard drive you have elected to monitor
- Logical Disks -- Displays a bar graphic for each monitored partition, showing the percentage of space in use; double-click a bar to get a detailed chart of space usage
- Miscellaneous Monitors and Other Functions: In addition to the listed monitor functions, SmartBar includes:
- Date/Time -- Depending on the configuration, this small clock module shows the time, the date, and the day of the week
- Shutdown -- This variation on the standard OS/2 shutdown can be configured -- as a part of the shutdown sequence -- to close active tasks, run up to three designated programs, and delay the shutdown process for a specified number of seconds
SmartBar Installation and Use
To install SmartBar, simply unzip the archive to a suitable directory. Run SETUP.CMD to create a folder on the desktop containing references to the executable and the on-line user guide. The installation script places a shadow of the executable in the OS/2 Startup folder, if requested, and can start SmartBar for the first time, if desired.
Initially, SmartBar starts as a (very thick) vertical bar aligned with the left side of the screen. All monitors and functions excepting Hardware Sensing and Mail Check are active. The default color is a bilious green, which may be deliberate to get the new user to open the settings notebook. The notebook pages control general look and feel (orientation, size, color, language, etc.) for the bar, and pages to control each of the monitors and facilities (activate/deactivate, style, and other pertinent matters).
Once configured (which isn't difficult) SmartBar gets high marks for usability. Basic information about system status is available at a glance. More detailed monitored data can be read by moving the mouse pointer over the bar segment in question to display a "bubble help."
For instance, the memory monitor on my system currently shows that I have 36.5mb of memory committed. When I move the mouse pointer over the monitor, the bubble tells me "Memory Usd.: 36.52MB Free: 27.10MB Tot: 63.63MB". Moving the pointer over an active process bar provides an instantaneous (and updated) reading on the percent of processor resources being used and the name (and path) of the process in question.
The configuration I have selected for my installation is a horizontal bar at the bottom of the screen. After trying many of the available colors, I have elected to stay with basic gray. I have disabled those monitors that don't provide any information I am interested in, and have collapsed some of the others that provide information I'm interested in only occasionally.
![]()
NLS -- Sort Of... and a Balky Monitor
For a freeware program, which suggests that development is a spare time activity, SmartBar works very well.
One issue -- which may or may not be significant, depending on your point of view -- is somewhat spotty National Language support. The program and the settings notebook display in English, German, French, or Italian (depending on your selection -- initial language is English). But, the on-line documentation and the help file are in Italian only. I have been told that this situation will be remedied "real soon, now."
An annoyance, which only manifested itself after Version 3.0 was installed, is that occasionally, the processor activity monitor does not start when the system is initially started. Alessandro attributes this behavior to a bug in some recent FixPaks related to a start delay or failure in the WarpCenter. He says that this problem should be substantially reduced or eliminated with the release of Version 3.1.
SmartBar can be found on Hobbes at http://hobbes.nmsu.edu/cgi-bin/h-browse?sh=1&dir=/pub/os2/util/wps.
Coming Next:
First, if you haven't done so already, I suggest you consider what I've found to address my Task Management needs.
In Part 5, we venture into the desert wasteland of virtual desktops.
- Part 1 (June 2000) - Defining Hog Heaven
- Part 2 (July 2000) - Matters of Style
- Part 3 (August 2000) - Focus on Files